The Thirsty Crow (Regression)
There is a very old fable about a crow and a partially-filled pitcher of water. Here is a modern retelling of the story, taken from an advertisement for Birla Sun Life, an Indian investment company.
Today you get to play the part of the crow! Brainstorm a few ideas to get to the water – you are a thirsty crow!
.
.
.
.
Here’s what the crow decided to do:
.
.
.
.
How many pebbles does the crow need?
.
.
Activity:
Gather your supplies: a cylindrical jar or glass filled about half-way, six stones, a ruler, a post-it for noting water heights, a GeoGebra Spreadsheet.
- Measure the height of the jar and subtract 2 centimeters – that’s the level the crow needs to be able to reach the water.
- Measure the height of the water in the jar and record it.
- One by one, add 6 stones to the water, recording the height of the water after each addition.
- Stop and make a prediction. How many more does he need to add?
Analysis:
Open the Thirsty Crow applet and follow the directions. (I have pre-loaded it for this presentation, but the full directions are below.)
Make Your Own Applet:

We will be using free, online software, called GeoGebra to do our analysis. Click on Free Software and choose your platform. Download the appropriate program.
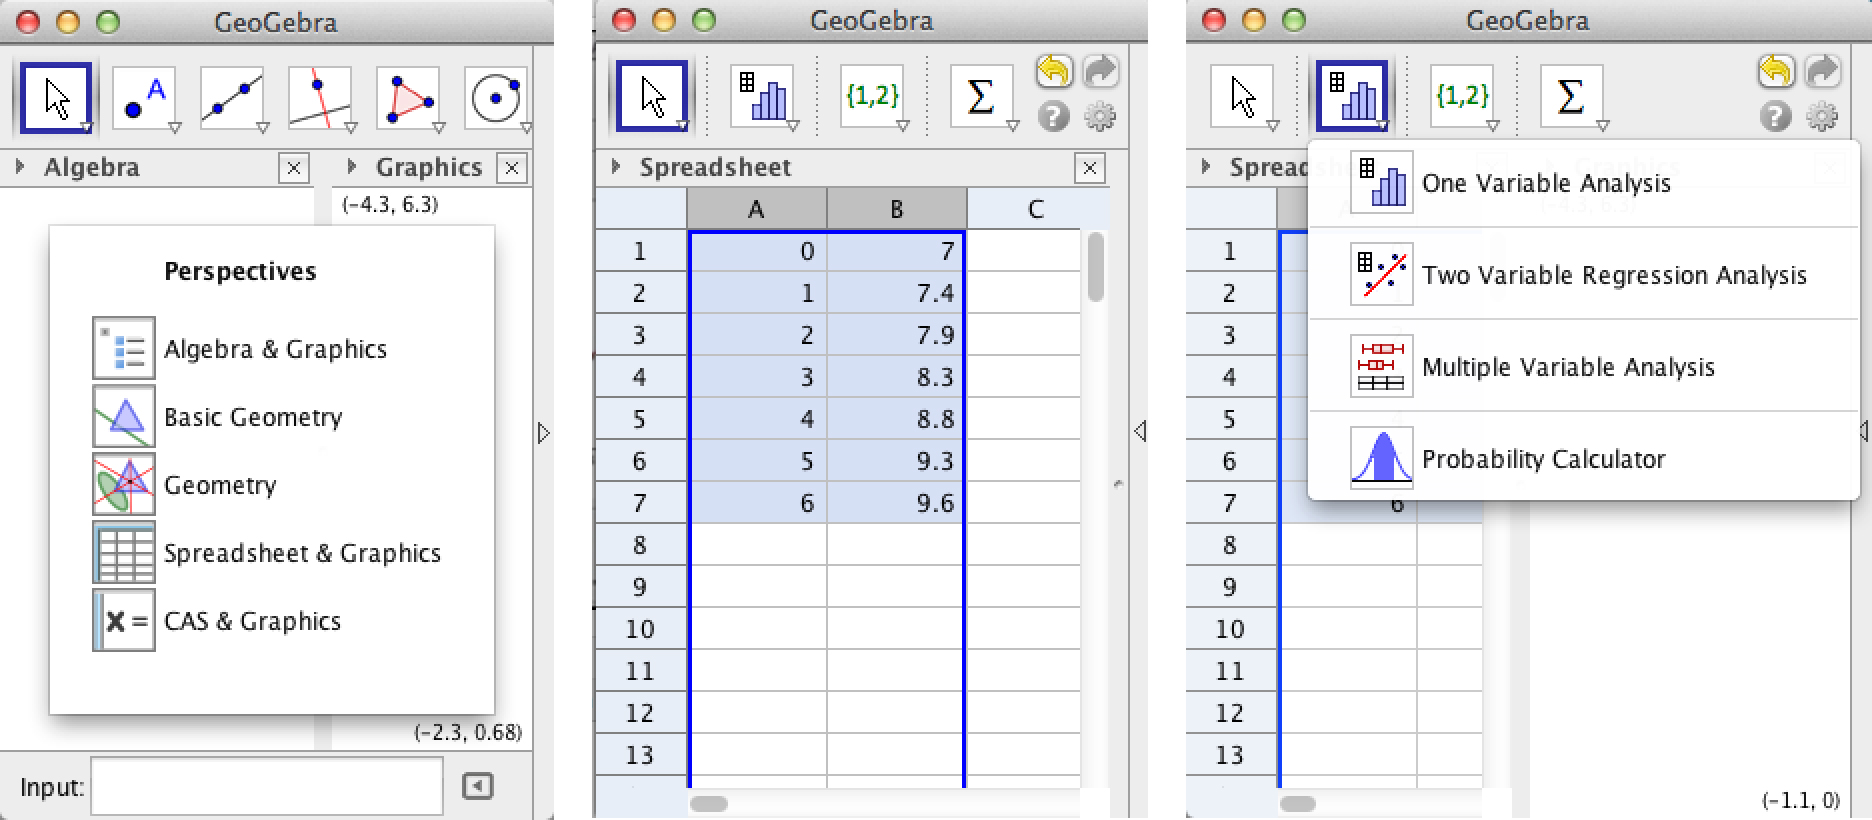
- Open the program and choose “Spreadsheets and Graphics” from the Perspectives window.
- Build your lists in columns A and B.
- Highlight the columns and click on the little arrow in the bottom corner of the second icon from the left.
- Choose Two Variable Regression Analysis.
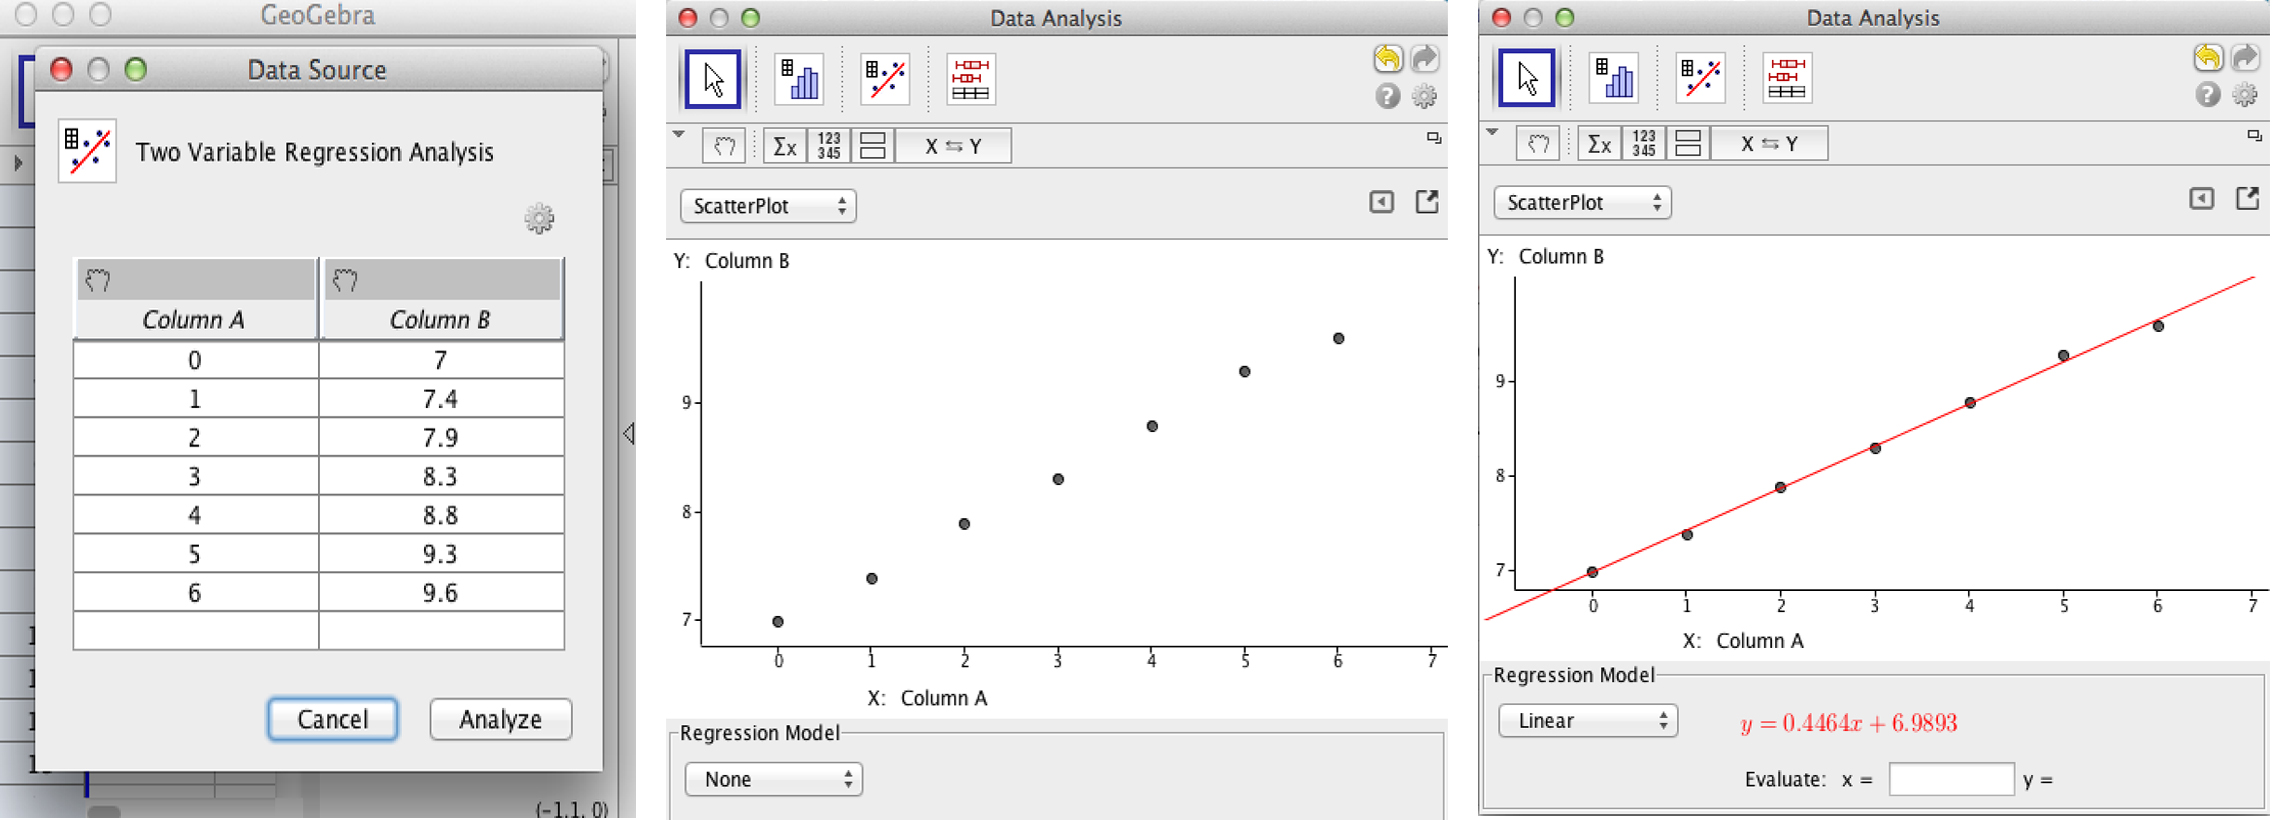
- Choose Analyze. Choose Linear from the “Regression Model” menu.


Interpretation:
The equation I got that best fits my data is y=0.4464x + 6.9893.
What do those numbers mean in terms of the situation?
How many more stones must she add?
Extension:
What could change in the problem?
How would that change the equation and graph?
